
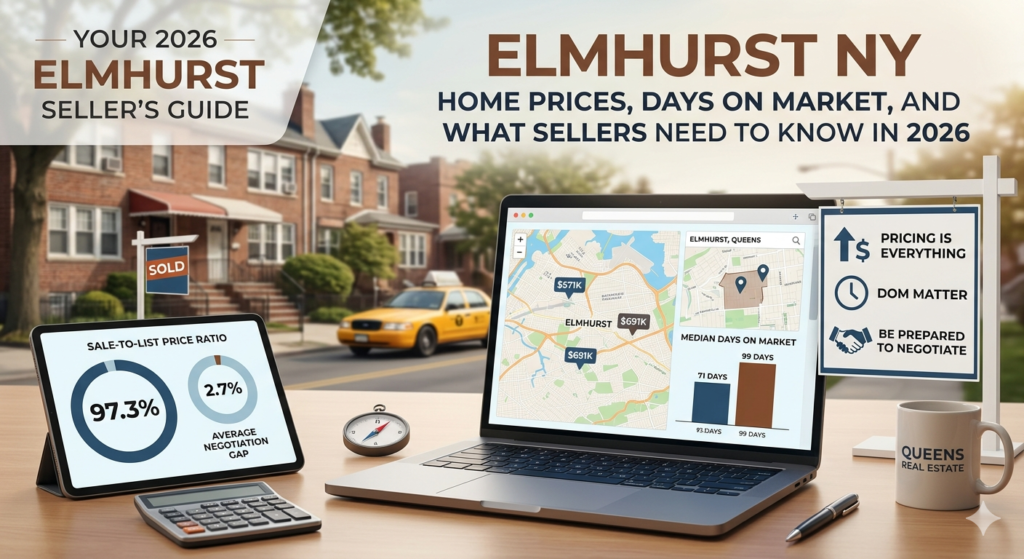
Elmhurst sellers in 2026 face roughly 197 active listings, a median home price between $571,500 and $691,500, and 71 to 99 days on market before closing. Well-priced homes are selling at 97.3% of list price. Overpriced homes are sitting and eventually selling for less anyway.
Elmhurst Market Snapshot: Early 2026
| Metric | Figure | Source |
|---|---|---|
| Active Listings | ~197 | Realtor.com |
| Median List Price | ~$571,500 | Realtor.com |
| Median Sale Price (Nov 2025) | ~$691,500 | Redfin |
| Avg. Days on Market | 92 days | Realtor.com |
| Days on Market Range | 71–99 days | Redfin / Realtor.com |
| Sale-to-List Price Ratio | 97.3% | Redfin |
| Avg. Discount from List Price | ~2.7% (~$16K on $600K) | Calculated |
| Co-op 1BR Average Price | $250,000–$300,000 | Market avg. |
| Co-op 2BR Average Price | $350,000–$400,000 | Market avg. |
| Single-Family Home Avg. | ~$900,000 | Market avg. |
| Two-Family Home Avg. | ~$1,200,000 | Market avg. |
| Avg. Housing Stock Age | ~49 years | Market avg. |
What the Numbers Mean for Elmhurst Sellers Right Now
The 97.3% sale-to-list ratio is the most important single number in this market. It tells you two things at once: sellers who price accurately are getting very close to their asking price, and sellers who don’t are absorbing a negotiated discount that almost always exceeds what a correctly priced listing would have cost them from the start. On a $600,000 home, the average 2.7% gap translates to roughly $16,000 real money that typically traces back to an optimistic launch price, not an ungenerous buyer.
The 71-to-99-day range sitting between the Redfin and Realtor.com figures reflects different methodologies and time windows, not a contradiction. Both point to the same reality: Elmhurst is not a fast market right now. Homes are spending two to three months on the market before closing, and the sellers who get to the closing table without a price cut are the ones who priced to the current market on day one.
What’s on the Market in Elmhurst
With approximately 197 active listings spanning co-ops, condos, single-family, and multi-family properties, Elmhurst buyers have choices and they are using them. Single-family homes typically list near $900,000, two-family properties around $1.2 million, and three-families, which are relatively rare, closer to $1.5 million. Each category attracts a distinct buyer profile, and condition and location within the neighborhood drive meaningful price variation within each tier.
Co-ops make up roughly 20 percent of the Elmhurst market and represent the most affordable ownership entry point, with one-bedroom units averaging between $195,000 and $200,000 and two-bedrooms between $350,000 and $375,000. The challenge with co-ops is that sellers are not just marketing an apartment they are marketing the building’s financials, board culture, and maintenance history alongside the unit itself. Buyers in 2026 are scrutinizing all of it, and a building with unresolved issues will drag even a well-priced unit into a longer market time.
What Has Sold in the Last 180 Days
The past six months in Elmhurst reflect a bifurcated market. Single-family and multi-family properties, where inventory is tightest and owner-occupant demand is most durable, are sustaining stronger price levels. Co-ops and condos, which face more competition and closer buyer scrutiny of building financials, are holding roughly flat year-over-year. The headline median figures differ by source because Redfin and Realtor.com use different property type compositions and time windows but directionally, both confirm the same market: active, price-sensitive, and slower than sellers expect.
Elmhurst’s housing stock averages around 49 years old, and condition is a primary driver of how quickly a property moves. Updated units, refreshed kitchens, baths, and mechanical systems consistently outperform original-condition properties in both days on market and final sale price. Sellers who invest in presentation before listing are not spending money they won’t recover. Sellers who skip it are pricing in the gap whether they intend to or not.
Days on Market: The Number That Tells the Real Story
Elmhurst homes are spending between 71 and 99 days on the market before selling. That is the market’s honest answer to the question of what overpricing costs. The most active, qualified buyers in any neighborhood are most engaged in the first 14 days a home is listed. After that window closes, urgency fades, showings thin out, and listings begin accumulating what agents call “market time stigma,” the question every buyer eventually asks about a home that has been sitting: what’s wrong with it?
An Elmhurst home priced within 3 to 5 percent of recent comparable closed sales has a real shot at generating interest in that first two-week window. The same home priced 5 to 8 percent above where comps suggest value sits will likely spend two to three months drifting before the seller accepts a lower number than a realistic price would have produced from the start.
Price Reductions: What’s Happening and Why
Price reductions in Elmhurst follow consistent, predictable patterns and almost all of them trace back to decisions made before the listing went live.
Overpricing at launch. The most common driver. Sellers anchor to what they paid, what a neighbor got in a different rate environment, or what an automated estimate suggests. None of those inputs reflect today’s buyer behavior. Recent comparable closed sales, current competing inventory, and days-on-market patterns for the same property type do.
Condition gaps. With an average housing stock age of 49 years, original-condition properties are consistently sitting longer than updated ones. Buyers have options at every price point and are choosing better-presented listings even when those cost more. The market will eventually price a condition deficit in the question is whether the seller does it proactively or reactively.
Co-op and condo building issues. Deals in co-op buildings fall apart when buyers discover high maintenance fees, pending assessments, or restrictive board policies mid-process. Sellers in buildings with financial or governance concerns need to price those factors into the list price from day one, not after a deal collapses at the board stage.
Interest rate sensitivity. Elmhurst buyers are predominantly owner-occupants financing their purchase. With mortgage rates remaining elevated well into 2026, monthly payment math is tight. A meaningful price reduction can be the difference between a buyer qualifying and walking away which is why the listings that eventually cut their price are doing so out of necessity, not negotiating strategy.
The Sweet Spot: Pricing Strategy by Property Type
The right list price in Elmhurst in 2026 is not the dream number it is the number that produces showings and offers in the first two weeks. For condos, pricing within 3 to 5 percent of recent comparable closed sales is the range that generates activity. For co-ops, the unit price and the building’s financial health are inseparable; a well-maintained apartment in a sound building can hold its value, while one in a building with deferred maintenance or an upcoming assessment must reflect that reality in the ask. For single-family and multi-family properties where inventory is tightest and demand most durable, there is more room to hold price, but the 14-day urgency window still applies.
In a market where the average seller is netting 97.3 cents on every listed dollar, the sellers achieving that figure are the ones who started at the right price. The ones below that average are the ones who started too high, waited, cut, and then negotiated from a weakened position.
FAQ: Common Pricing Mistakes Elmhurst Sellers Make
Pricing based on what you need, not what the market supports. What you paid for your home, what you owe, or what you need to net after fees does not determine market value. Buyers are comparing your listing to every other option at your price point in Elmhurst right now your financial situation does not factor into their calculation.
Waiting for spring to list, then overpricing. Spring brings more buyers, but it also brings more listings. Launching at an optimistic price and missing the seasonal window leaves sellers sitting through summer with growing days on market and diminishing leverage.
Ignoring feedback after 30 days. If your Elmhurst home has been on the market for more than 30 days with few showings and no offers, the market is sending a clear signal. The answer is almost never “wait for the right buyer.” It is almost always a pricing or presentation issue and addressing it sooner limits the damage.
Treating automated estimates as comps. Zillow and similar tools generate values from public records and algorithms. They are not the same as a comparative market analysis built from actual closed sales in your zip code and property type over the past 90 days. In a neighborhood as varied as Elmhurst, the difference matters.
What Sells Fast in Elmhurst Right Now
Updated two-bedroom condos near the E, F, M, or R trains, multi-family properties priced to reflect current rental income in a high-rate environment, and single-family homes in good school zones with parking, one of the most undersupplied features in this neighborhood, are consistently outperforming the market average when priced correctly. What is sitting: original-condition co-ops with high maintenance fees, units in buildings with unresolved financial issues, and any property launched meaningfully above recent comparable sales. The Elmhurst market in 2026 is not rewarding patience. It is rewarding accuracy.
Summary
Elmhurst in 2026 is a market where pricing discipline is the difference between a smooth sale and an expensive stall. With approximately 197 active listings, homes spending 71 to 99 days on market, and a sale-to-list ratio of 97.3%, the data is consistent: well-priced homes sell, overpriced homes sit and negotiate. Sellers who anchor to current comparable sales, address condition before listing, and treat the first two weeks as their most valuable window will net the most from their Elmhurst home this year.
Thinking about selling your Elmhurst home and want to know what it’s actually worth in today’s market? Contact me for a comparative market analysis built on current data, not automated estimates.
Data sources: Realtor.com (active listings, median list price, days on market); Redfin (November 2025 median sale price, sale-to-list ratio, days on market). Property type price ranges reflect market averages; confirm against current MLS data before publishing.